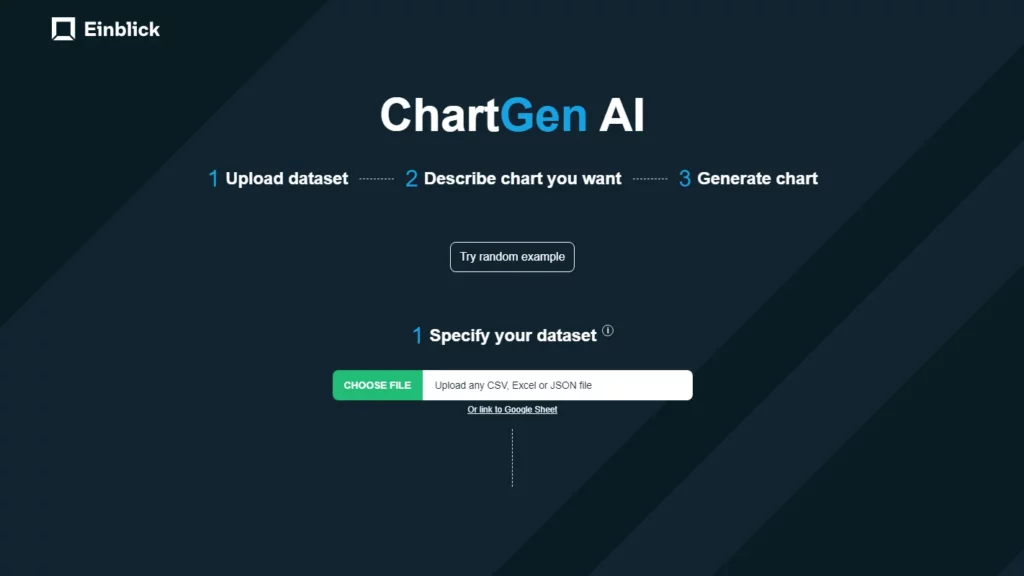
Chartgenai provides a user-friendly solution for creating visually appealing charts and graphs using data. It supports various data formats such as CSV, Excel, and JSON, and allows users to link to Google Sheets for data access. Additionally, it incorporates Python transformations and AI-powered data analytics. The tool is designed for multiple use cases including data visualization, reports and presentations, statistical analysis, business intelligence, and data storytelling. Users can upload their datasets, describe the desired chart, and generate the chart through a simple process involving three steps: upload dataset, describe chart, and generate chart.
⚡Top 5 ChartGen AI Features:
- User-Friendly Interface: The platform has a straightforward design, making it easy for users with minimal technical skills to navigate.
- Natural Language Capabilities: ChartGen AI translates user descriptions into visual data seamlessly.
- Speedy Generation: Charts are generated quickly, saving time for data analysis and decision-making.
- File Format Flexibility: The platform supports multiple file formats, catering to a wide range of users.
- Data Security: Users should check the privacy policy and security measures of the platform to ensure data protection.
⚡Top 5 ChartGen AI Use Cases:
- Research Presentations: Students can use ChartGen AI to create visuals for their research findings.
- Business Analytics: Business analysts can generate charts for reports or presentations.
- Data Visualization Exploration: Individuals curious about data can utilize ChartGen AI to explore datasets.
- Standard Charts Generation: The tool provides an efficient route to creating standard charts across various disciplines.
- Advanced Data Analytics: For more complex tasks, users may need to explore other advanced data analysis software.
